
Does Home Advantage Get Stronger Down the Non-League Pyramid?
An analysis of 2,828 matches across six levels of the English non-league pyramid asks whether home advantage changes from Step 1 to Step 6.

Freelance Football Writer · 30 September 2026 · 10 min read
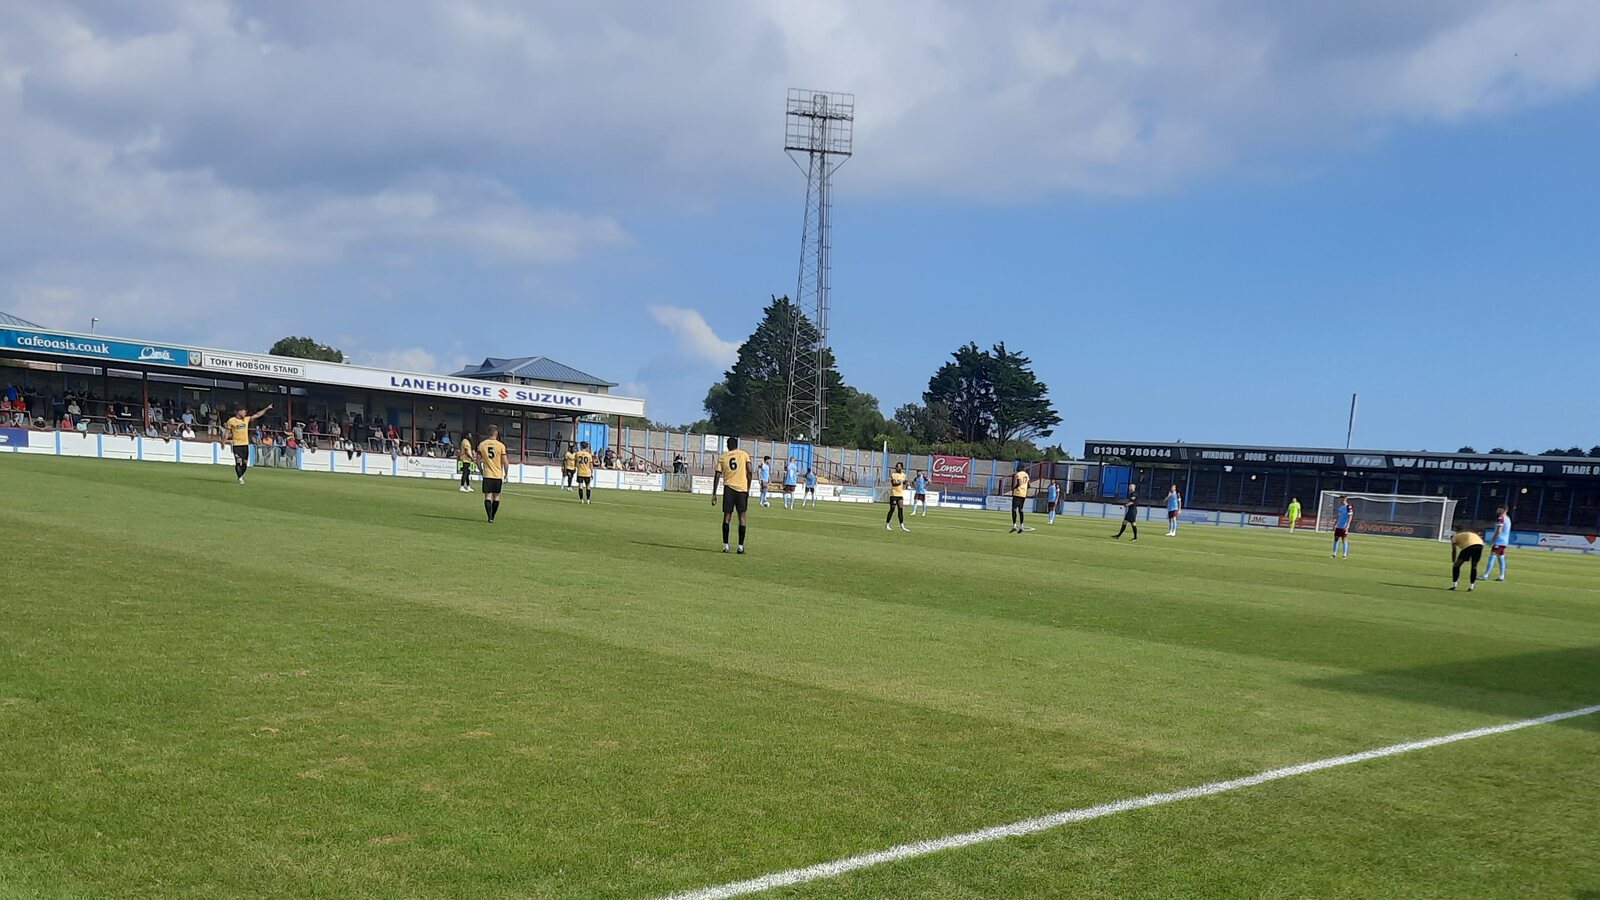
Photo by Harold9595959, CC BY-SA 4.0, via Wikimedia Commons (cropped)
Home advantage is one of football’s most familiar concepts. Across all levels of the game, there’s an obvious difference between playing in familiar surroundings and travelling to someone else’s ground, but the extent to which that matters is less straightforward.
This piece looks at that question across six levels of the English non-league pyramid during the 2025/26 season, from the National League at Step 1 through to the Eastern Counties League Division One South at Step 6. The divisions included are:
Step 1: National League
Step 2: National League South
Step 3: Isthmian League Premier Division
Step 4: Isthmian League North Division
Step 5: Essex Senior League
Step 6: Eastern Counties League Division One South
The dataset covers 133 clubs and 2,828 matches, using each club’s home and away records across the season to compare performance at each level.
Rather than purely looking at individual matches or teams, the analysis looks at the aggregate differences between home and away performance in each division. The aim is not to find out what causes home advantage, but to find out how its size compares between the different levels included in the sample.
That leads to the main question: is there a relationship between league level and the size of home advantage?
Methodology
To measure home advantage, the analysis collected the home and away records of every club included in the six selected divisions during the 2025/26 regular season.
For each club, the dataset recorded home wins, draws, losses, goals scored and goals conceded, alongside the equivalent figures from away matches. These figures were then aggregated at division level, allowing the six leagues to be compared using the same measures.
The analysis uses three main groups of measures. The first looks at results, through home win percentage, draw percentage and away win percentage. The second looks at performance, using home points per game (PPG), away PPG and the difference between the two.
The home PPG advantage is calculated simply as home PPG minus away PPG. A positive figure therefore indicates that teams in that division collected more points per game at home than away.
The final group measures goals, using home goals per game, away goals per game and total goals per game.
Only completed regular-season league matches from the 2025/26 pyramid are included. Play-off matches or abandoned games are not included, unless the result was officially declared by the league and formed part of the final table. All data was gathered from Football Web Pages and combined to produce the division-level figures used throughout the analysis.
The analysis therefore measures observed differences between home and away performance rather than attempting to identify their individual causes.
The Overall Picture
Across the six levels and 2,800+ matches in the dataset, the basic idea of home advantage is very clear. Home teams won 43.97% of matches in the 2025/26 sample, compared with 34.38% for away sides, while 21.65% ended in draws.
The difference is just as apparent when looking at points instead of results. Home teams averaged 1.54 points per game at home, compared with 1.25 points per game away from home, giving home sides an overall advantage of 0.29 points per game.
The gap continues in front of goal. Home teams averaged 1.71 goals per game, compared with 1.47 for away sides, with matches across the six levels averaging 1.59 goals per game.
That, of course, is hardly a groundbreaking discovery. Any football fan or regular watcher is familiar with the concept of home advantage, even if the size of that advantage can vary between clubs, seasons, leagues and stadiums.
The more interesting question is what happens when the levels are separated. If home advantage exists throughout the pyramid, is it equally pronounced at every level?
That does not necessarily mean looking for a simple or linear progression from Step 1 to Step 6, or vice versa. The real question is whether the size of the home/away gap changes depending on where a division sits within the non-league pyramid.
Step-by-Step: Does Home Advantage Change?
With the overall numbers established, the next question is whether the advantage changes as we move down the pyramid.
Step 1
Starting at Step 1, the National League provides a rather expected but helpful starting point. Home teams won 43.30% of matches, compared with 33.51% for away sides, with the average home side collecting 1.53 points per game at home compared with 1.24 away.
That gives a home PPG advantage of 0.29, exactly matching the figure across the six-level average. Matches produced an average of 1.46 goals per game, 1.59 for home teams and 1.34 for the visitors.
Step 2
In the National League South, home teams won 47.10% of matches, while away sides won just 30.07%. Home teams also won 1.64 points per game, compared with 1.13 away from home, producing a 0.51-point home advantage over the season.
Home teams won 17.03 percentage points more often than away teams, while the gap between home and away goals per game was 0.36.
Step 3
Step 3, the Isthmian Premier Division, saw home teams find it harder to win matches. Home sides won 41.77% of matches, compared with 35.06% for away teams. The home PPG advantage falls to just 0.20, less than half the figure recorded in the National South and below the National League figure.
The average match produced 1.60 goals per game, slightly more than either of the two higher levels, but the home/away performance gap itself was considerably smaller. Step 3 therefore sees more goals per game and more away wins than either of the levels above it.
Step 4
The Isthmian League North sees the home PPG advantage move upwards again, with home teams winning 45.89% of matches compared with 33.33% for away sides.
The PPG advantage rises to 0.38, almost double the Step 3 figure, while goals per game drops to 1.49.
Step 5
Then comes the Essex Senior League, where home teams won 41.95% of matches, only 3.16 percentage points more often than away teams at 38.79%, while home sides averaged 1.45 points per game against 1.36 away. The resulting home PPG advantage is just 0.09.
The difference in goals is similarly small, as home teams scored 1.79 goals per game compared with 1.70 away, a gap of just 0.09.
Step 6
Finally, the Eastern Counties League Division One South sees a slight recovery again. Home teams won 42.86% of matches, compared with 37.62% for away sides, while home PPG stood at 1.48 against 1.32 away, producing a 0.16-point home advantage.
Having reached the bottom of the six-level sample, the figures can now be compared directly to see whether the changes amount to any relationship between league level and the size of home advantage.
The Answer: Does Home Advantage Get Stronger?
So, does home advantage get stronger as we move down the pyramid?
The home PPG advantage across the six divisions, beginning with the National League, was:
+0.29 → +0.51 → +0.20 → +0.38 → +0.09 → +0.16
There is no obvious progression here. The figure rises from Step 1 to Step 2, falls sharply at Step 3, rises again at Step 4, drops to its lowest point at Step 5 and then recovers slightly at Step 6.
The largest gap, +0.51, came in the National League South, while the smallest, +0.09, came in the Essex Senior League. The difference between them is 0.42 points per game, but neither represents an end point of the non-league pyramid.
That makes the answer fairly straightforward: in this 2025/26 sample, home advantage does not consistently increase or decrease with league level. The six divisions produce noticeably different results, but their position within the pyramid does not correspond to a clear pattern in the size of the home PPG advantage.
There is, however, another pattern in the data worth exploring. While the size of home advantage moves around, the scoring environment changes more noticeably between the higher and lower levels.
But Something Does Change: Goals
The goalscoring data shows a different pattern. Goals per game across the six levels, again starting with Step 1, were:
1.46 → 1.43 → 1.60 → 1.49 → 1.75 → 1.96
The progression is not perfectly consistent, but the difference between the two ends of the sample is clear. Matches averaged 1.46 goals per game at Step 1 and 1.96 at Step 6, a difference of 0.50 goals per game.
That increase comes from both sides. Home goals per game rose from 1.59 at Step 1 to 2.05 at Step 6, while away goals increased from 1.34 to 1.87. The higher-scoring environment towards the bottom of the sample was therefore not simply driven by home teams.
The home/away goal difference tells a different story. It was 0.25 at Step 1, 0.36 at Step 2, 0.16 at Step 3, 0.35 at Step 4, 0.09 at Step 5 and 0.18 at Step 6. Like the PPG figures, it moves around rather than following a consistent direction.
The clearer change is in the overall scoring environment rather than the size of the home/away gap. That is an observed difference in this particular 2025/26 sample, not evidence that league level itself causes matches to contain more goals.
Why Might Home Advantage Differ?
There are plenty of possible reasons why home advantage exists in football. A home team plays in familiar surroundings, knows its own pitch and facilities, follows a usual matchday routine, has less travel time and is surrounded by familiar personnel and supporters. An away side has to adapt to those conditions when it arrives at its opponent’s ground.
Home supporters are one obvious consideration. If crowd size and atmosphere were major drivers of home advantage, you might expect the effect to become more pronounced higher up the pyramid, where clubs generally attract larger attendances. A Step 1 or 2 fixture may attract thousands of supporters, whereas some clubs at Steps 5 and 6 will regularly play in front of double-figure crowds.
That does not mean attendance can be ruled out as a factor. Home records differ from club to club, and the dataset does not contain enough information to establish how much crowd size contributes to the differences between divisions.
The ground itself is another variable. Players know how their pitch plays at different times of year and what to expect from a typical home matchday. This may be particularly relevant in non-league, where grounds can differ significantly in size, facilities, pitch dimensions and surface. Ground sharing can complicate that relationship, while artificial pitches may also affect how much adjustment is required from visiting teams.
Travel and geography could matter too. Some divisions cover much larger geographical areas than others, meaning an away team can face a substantially longer journey depending on the league and fixture. Lower-level divisions can often be more geographically concentrated, although that varies considerably between competitions. The dataset does not measure travel distances or journey times, so their effect cannot be separated from the other factors involved.
The composition of each division matters as well. A league containing several particularly strong clubs may produce different home and away figures from one with a more even spread of ability. A well-resourced side might perform strongly regardless of venue, while a weaker team could struggle in either setting.
The figures reflect a particular collection of clubs, grounds, fixtures and circumstances during 2025/26. They show what happened, but not how much each potential influence contributed to the result.
The Limits of the Dataset
The figures need to be viewed within the boundaries of the sample. This is one season of data, covering a specific selection of leagues and clubs, so it cannot show whether the same patterns would appear over a longer period.
The clubs involved change from season to season through promotion and relegation, while managers, players and the balance of strength within individual divisions can change considerably. A five, 10 or 15-year study could therefore produce a different picture.
The sample also does not include every league at every level, apart from Step 1, where the National League is the sole division. The analysis covers selected competitions at Steps 2 to 6 and is heavily focused on the south and south-east of England. A broader geographical sample could produce different results.
The leagues themselves are not identical in size either. Steps 1 and 2 have 24 clubs, Steps 3 and 4 contain 22, Step 5 has 20 and the Step 6 division has 21. That means the number of matches differs between levels, while the particular mix of clubs in each division can also influence its aggregate figures.
These factors do not invalidate the comparisons, but they determine what can reasonably be taken from them. This is a snapshot of observed home and away performance across six selected levels during 2025/26, rather than a definitive measure of home advantage across the English football pyramid.
Conclusion
So, does home advantage get stronger as we move down the pyramid?
Apparently not.
The figures jump around too much to suggest any clear pattern: Step 2 produces the biggest advantage, while Step 5 produces the smallest. The goals data provides an interesting side story, rising from 1.46 per game at Step 1 to 1.96 at Step 6, but it does not change the main finding.
Home advantage exists whether you are in Step 1 or Step 6. The pyramid, it seems, does not have quite as much influence as you might expect.
Keep reading